Abound Net Zero Management
Are You on Track to Meet Your Energy and Sustainability Goals?
Environmental, social, and governance (ESG) disclosure requirements and corporate goals have made energy efficiency and reducing greenhouse gas (GHG) emissions a priority, driving the need to take action and report on progress.
Click here to begin your Limited Free Trial of Abound™ Net Zero Management today!
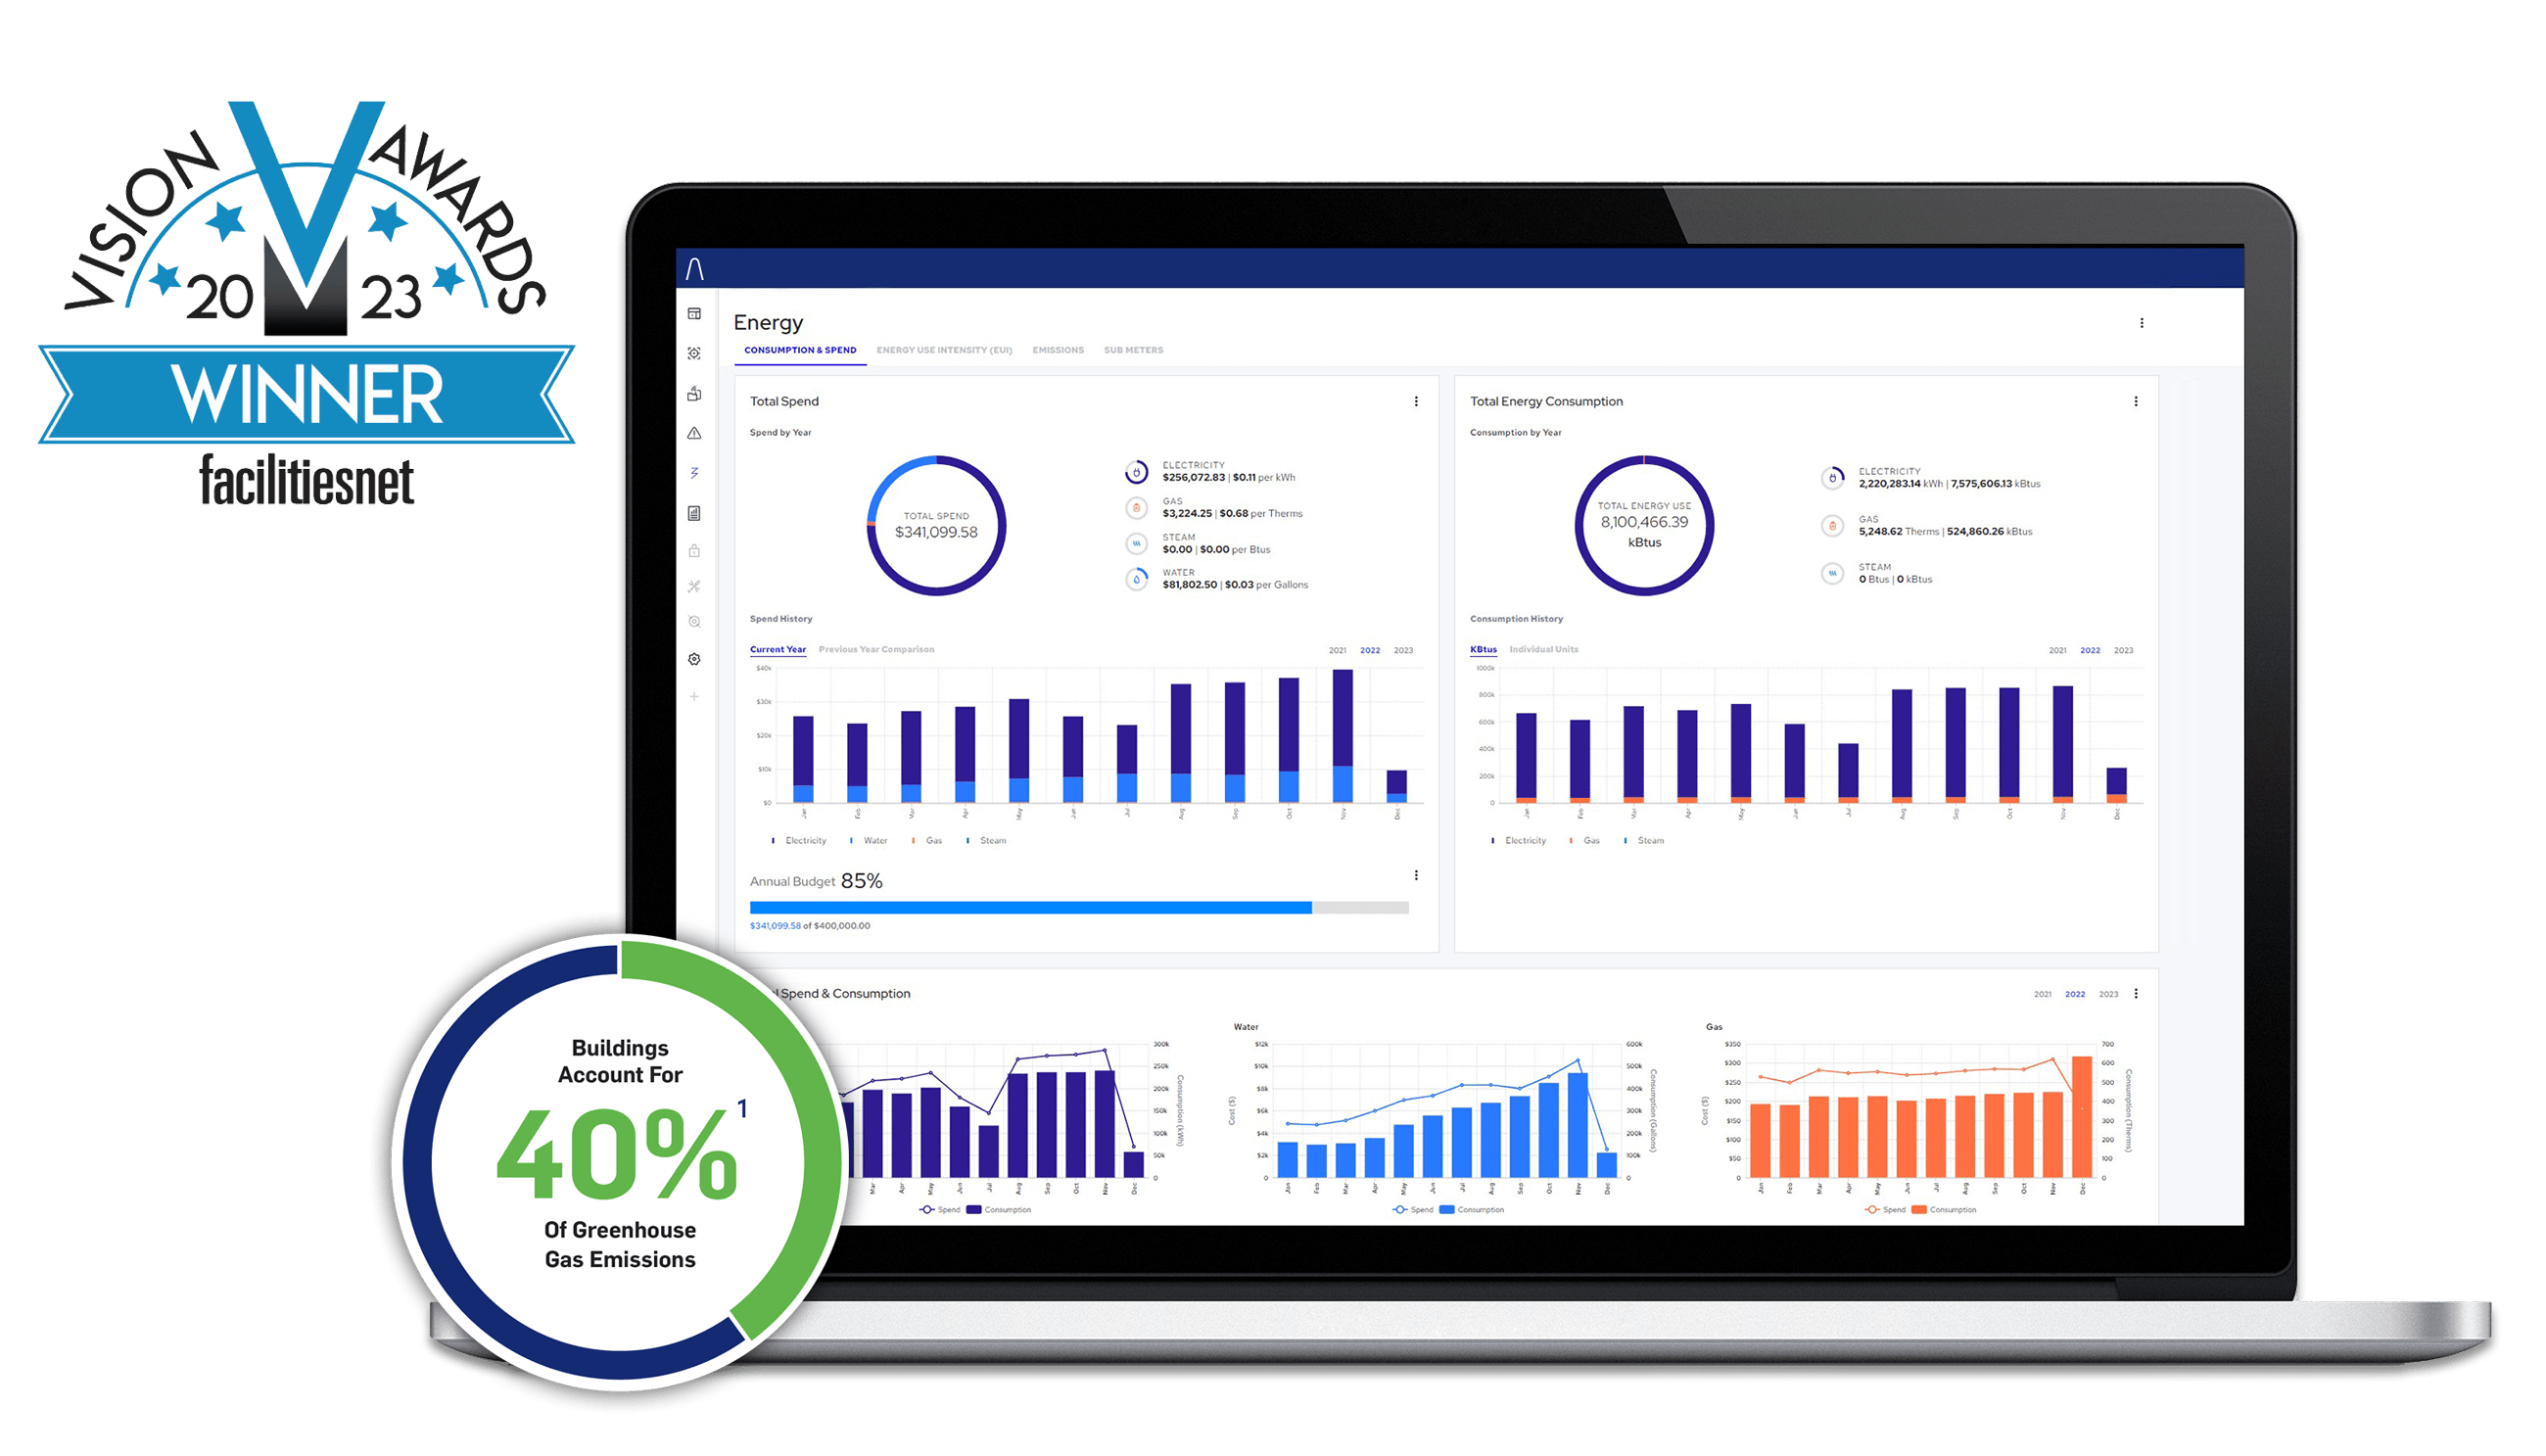
Abound Net Zero Management provides a way to view a building portfolios' performance and drill down into individual building metrics:
 Track and analyze energy use and benchmark across other buildings
- Make energy and emissions data readily accessible to key stakeholders
- Proactively identify conservation measures
- Reduce the risk of noncompliance
Abound Net Zero Management is Rich with Features
Measure
- Manually insert or automatically collect utility data for visualization
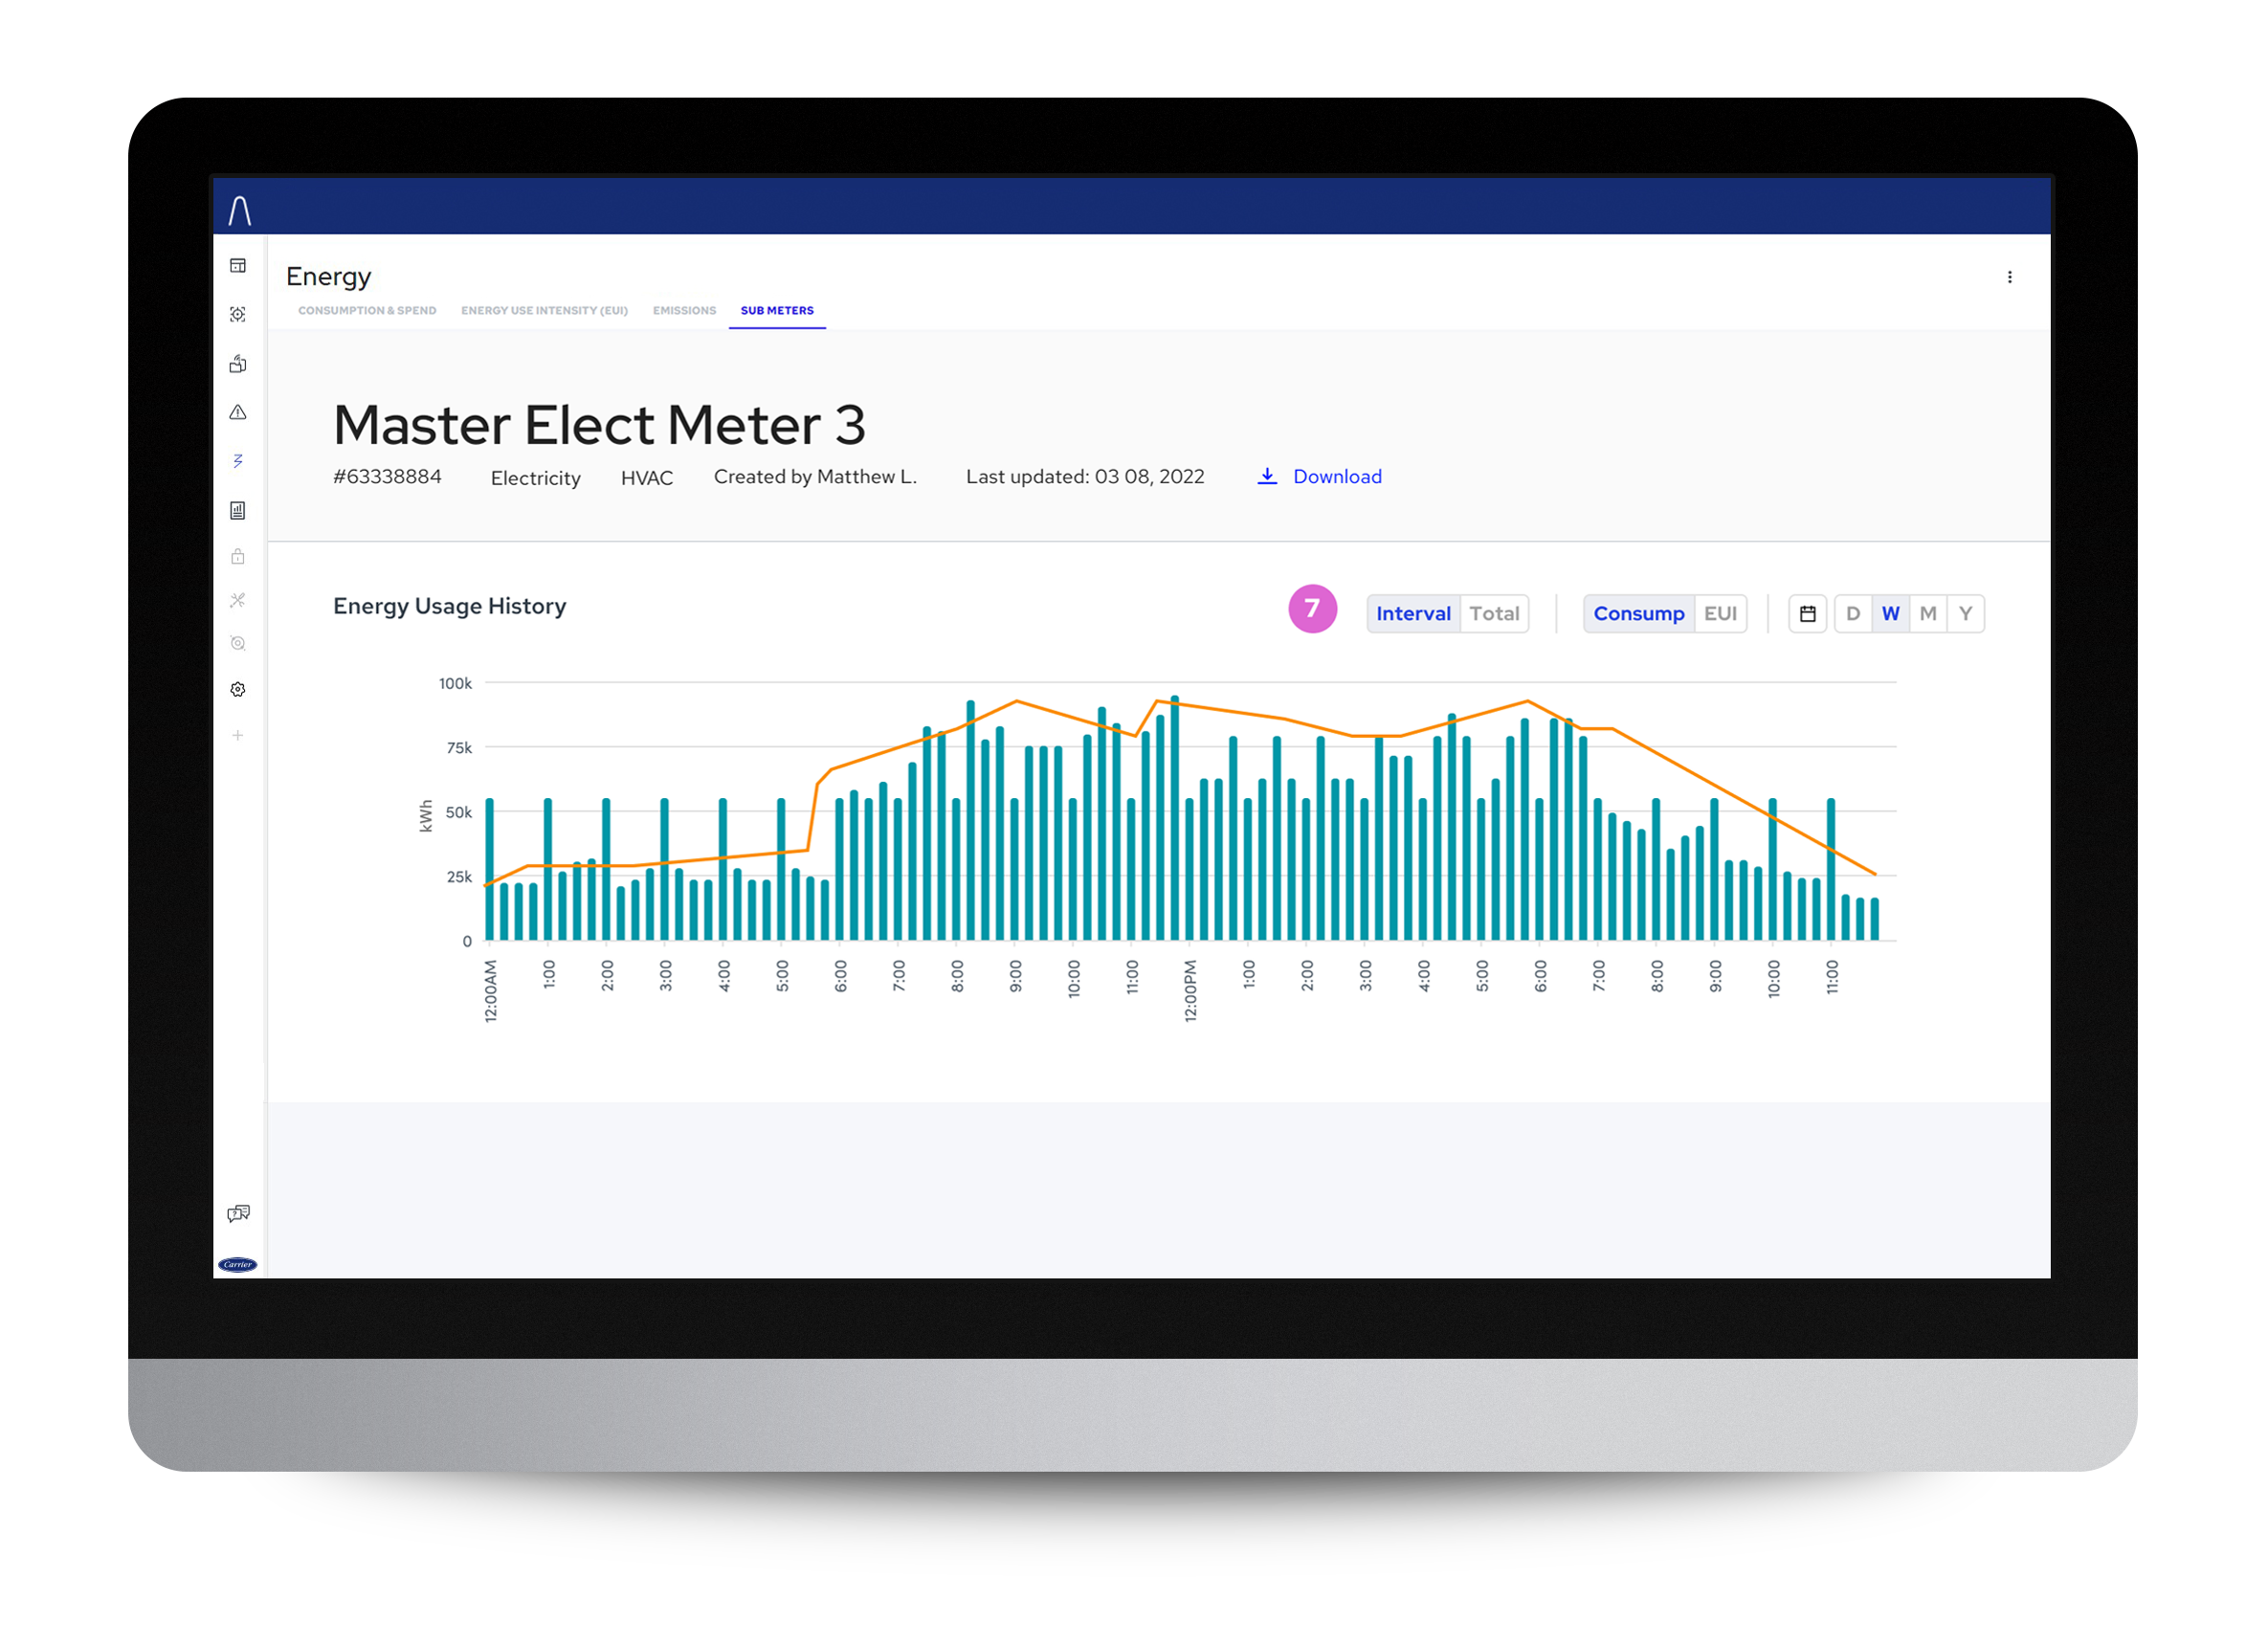
- Easily integrate submeter data to get in-depth insights into usage and demand
- Calculate GHG emissions based on regional emission factors
Evaluate
- Accurate reporting of energy consumption, spend, and Scope 1 & 2 GHG emissions2
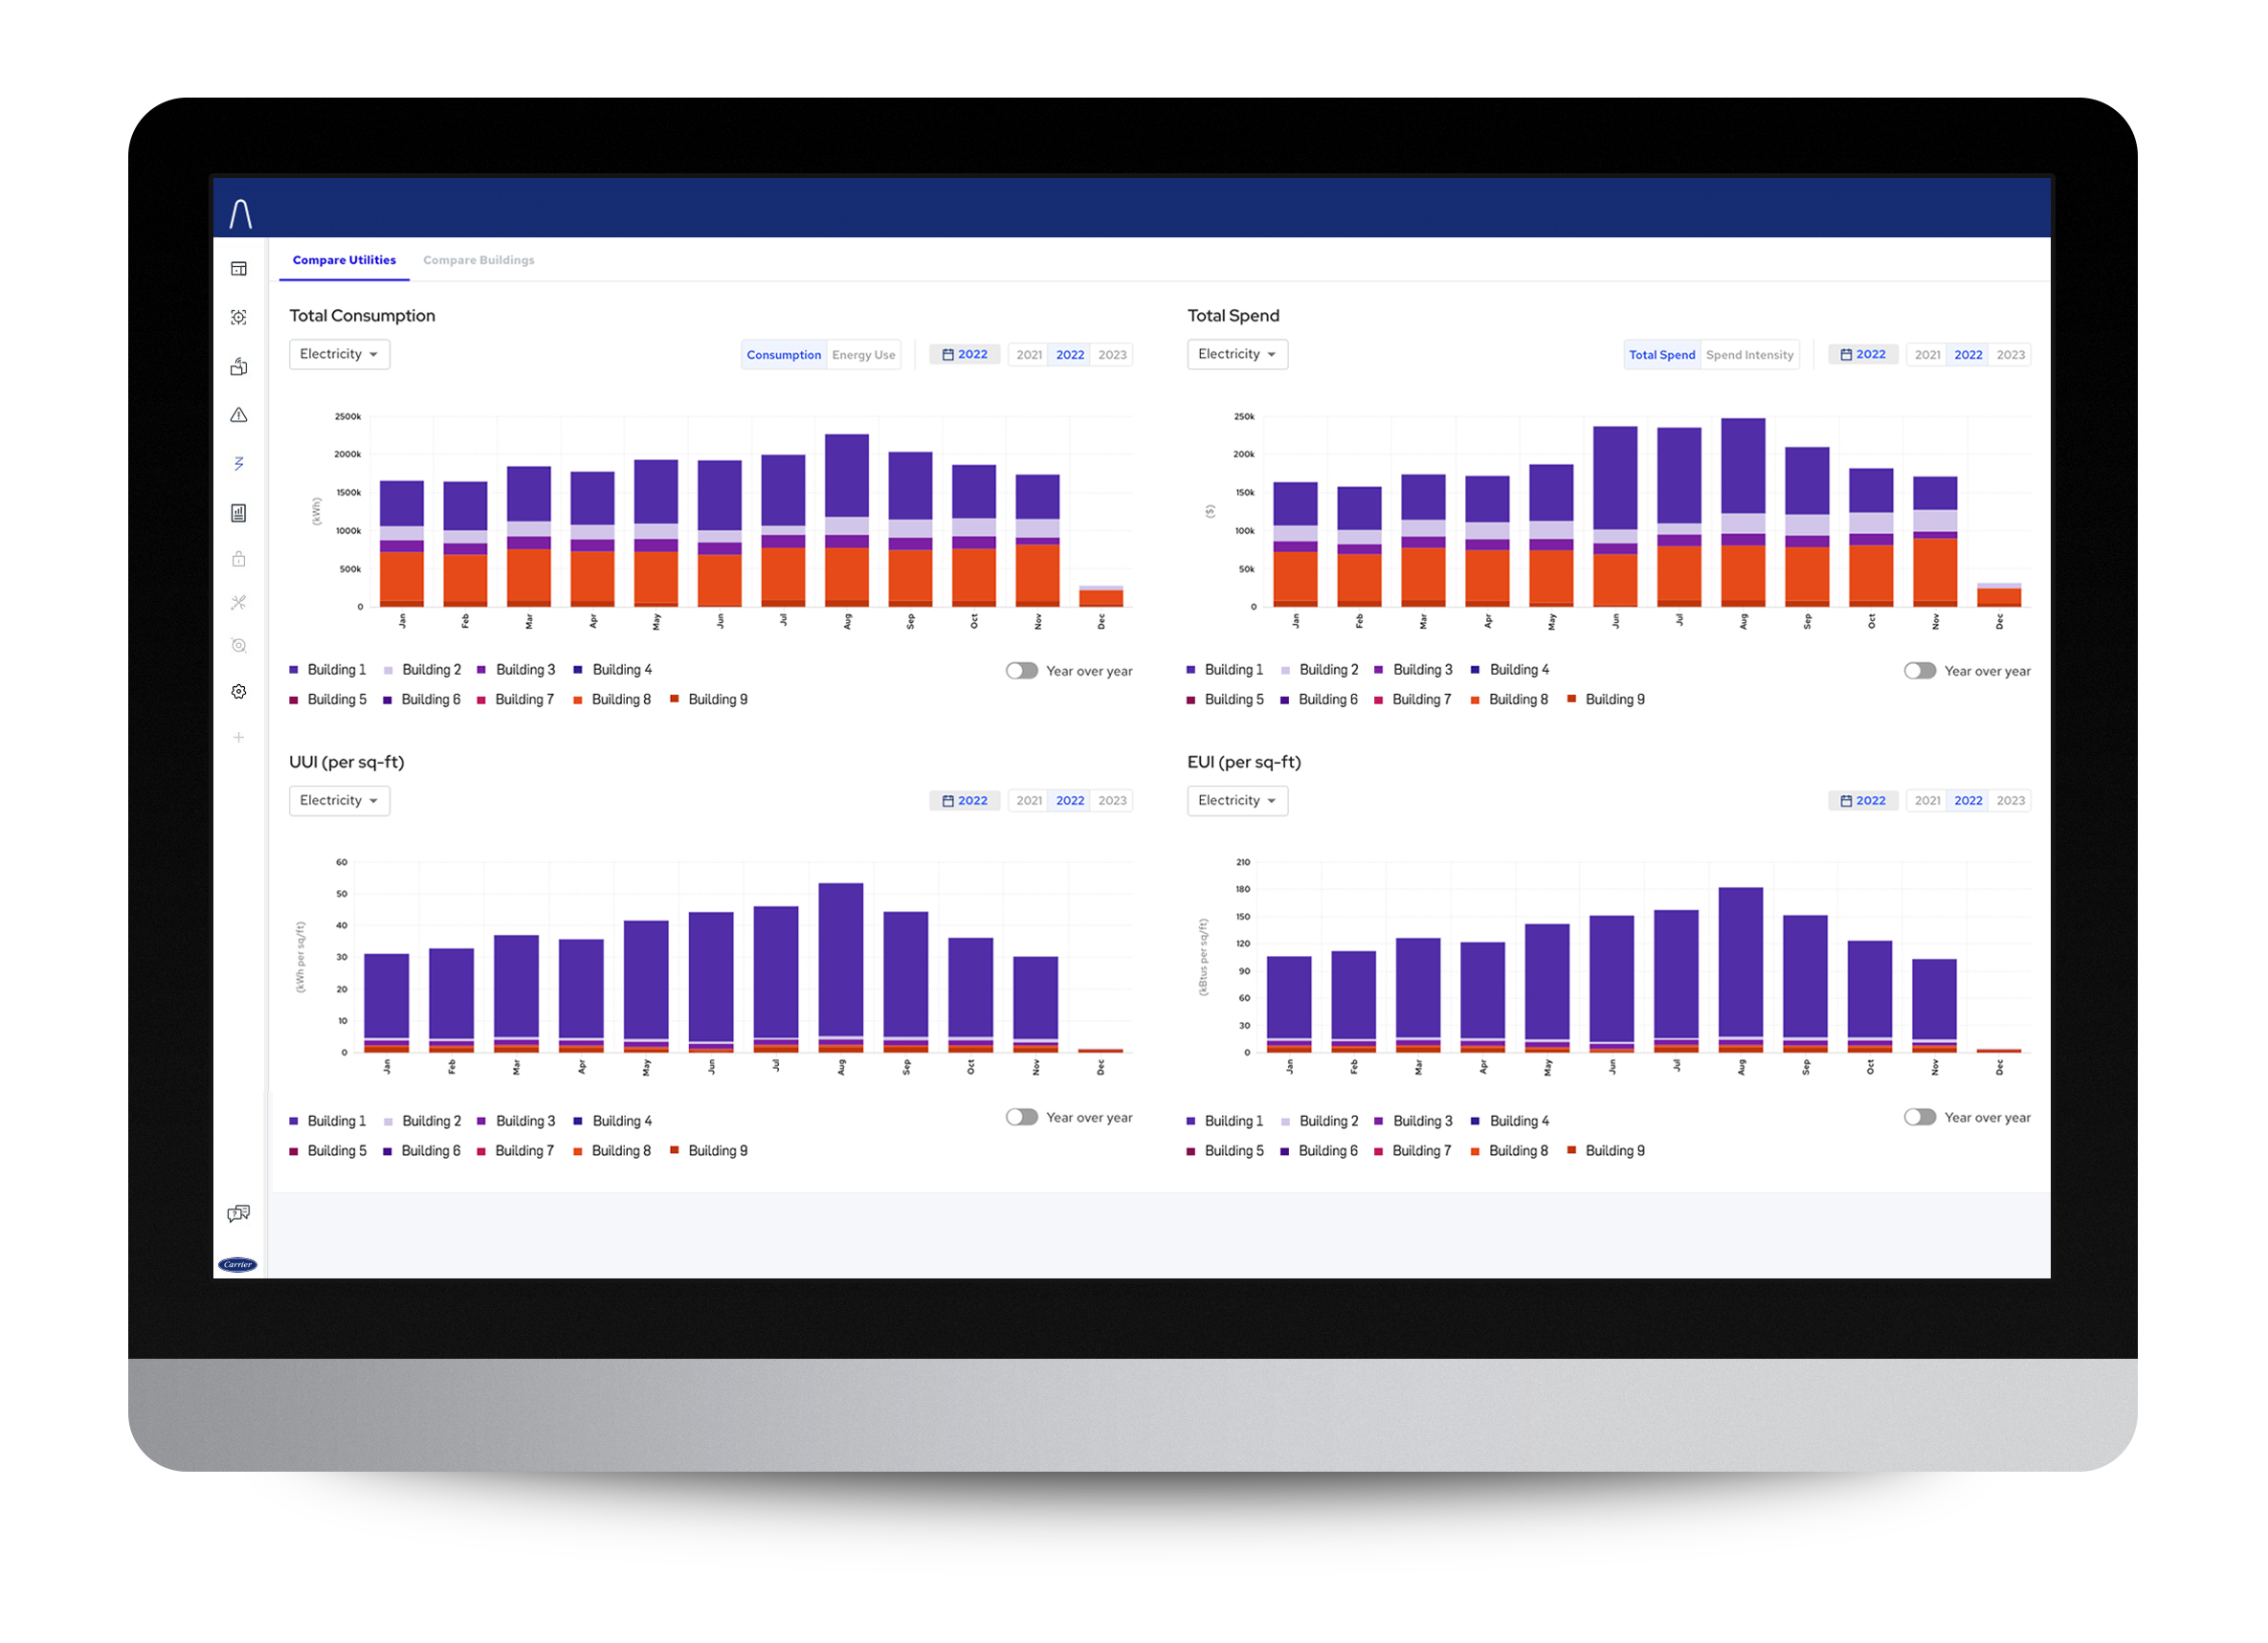
- Identify underperforming equipment or buildings
- Compare benchmarks across buildings in one central platform
Take Action
- Share energy and emissions data across roles and departments within your organization
- Download data and graphs to ensure consistent and timely submissions of critical data to auditing authorities
- Prioritize specific energy and carbon reduction measures
- Fix operational issues such as inefficient scheduling
We can help you reach your energy and sustainability goals with Abound Net Zero Management.
Connect with an Abound expert today!
Connect with an Abound expert today!